Introduction
rhino is a shiny framework focused on
building applications with the best software engineering practices in
mind. This tutorial will show you how you can use
shiny.router in a Rhino app.
You can read more about rhino on the documentation page.
Setup Rhino application
The first step is to create a Rhino application. Before that, make
sure that you have rhino installed:
install.packages("rhino")Now, initialize a new Rhino application. You can do it either by
using RStudio Wizard or a function
rhino::init("rhino_router"). More details on how to create
a Rhino app can be found in the Rhino
tutorial.
Add the basic content
To speed things up, we will use a basic version of the Rhino application described in the Rhino tutorial.
Add dependencies
First, we need to add the required dependencies:
- Install dependencies:
# In the R console
renv::install(c("dplyr", "echarts4r", "htmlwidgets", "reactable", "tidyr"))- Add dependencies to the
dependencies.Rfile:
# dependencies.R

# This file allows packrat (used by rsconnect during deployment) to pick up dependencies.
library(dplyr)
library(echarts4r)
library(htmlwidgets)
library(reactable)
library(rhino)
library(tidyr)- Update the
renv.lockfile:
# in R console
renv::snapshot()
If you want to learn more about dependency management in Rhino, check this guide.
Add content
Next, we need to fill the application with the content.
In app/logic add two files, chart_utils.R
and data_transformation.R:
# app/logic/chart_utils.R

box::use(
  htmlwidgets[JS],
)

#' @export
label_formatter <- JS("(value, index) => value")
# app/logic/data_transformation.R

box::use(
  dplyr[arrange],
  tidyr[pivot_wider],
)

#' @export
transform_data <- function(data) {
  pivot_wider(
    data = data,
    names_from = Species,
    values_from = Population
  ) |>
    arrange(Year)
}
We will add two views - a chart and a table. In app/view
add chart.R and table.R files:
# app/view/chart.R

box::use(
  echarts4r,
  shiny[h3, moduleServer, NS, tagList],
)
box::use(
  app/logic/chart_utils[label_formatter],
)

#' @export
ui <- function(id) {
  ns <- NS(id)

  tagList(
    h3("Chart"),
    echarts4r$echarts4rOutput(ns("chart"))
  )
}

#' @export
server <- function(id, data) {
  moduleServer(id, function(input, output, session) {
    output$chart <- echarts4r$renderEcharts4r(
      data |>
        echarts4r$group_by(Species) |>
        echarts4r$e_chart(x = Year) |>
        echarts4r$e_line(Population) |>
        echarts4r$e_x_axis(
          Year,
          axisLabel = list(
            formatter = label_formatter
          )
        ) |>
        echarts4r$e_tooltip()
    )
  })
}
# app/view/table.R

box::use(
  reactable,
  shiny[h3, moduleServer, NS, tagList],
)
box::use(
  app/logic/data_transformation[transform_data],
)

#' @export
ui <- function(id) {
  ns <- NS(id)

  tagList(
    h3("Table"),
    reactable$reactableOutput(ns("table"))
  )
}

#' @export
server <- function(id, data) {
  moduleServer(id, function(input, output, session) {
    output$table <- reactable$renderReactable(
      data |>
        transform_data() |>
        reactable$reactable()
    )
  })
}
The last step is to update app/main.R:
# app/main.R
box::use(
shiny[bootstrapPage, moduleServer, NS],
)
box::use(
app/view/chart,
app/view/table,
)
#' @export
ui <- function(id) {
ns <- NS(id)
bootstrapPage(
table$ui(ns("table")),
chart$ui(ns("chart"))
)
}
#' @export
server <- function(id) {
moduleServer(id, function(input, output, session) {
# Datasets are the only case when you need to use :: in `box`.
# This issue should be solved in the next `box` release.
data <- rhino::rhinos
table$server("table", data = data)
chart$server("chart", data = data)
})
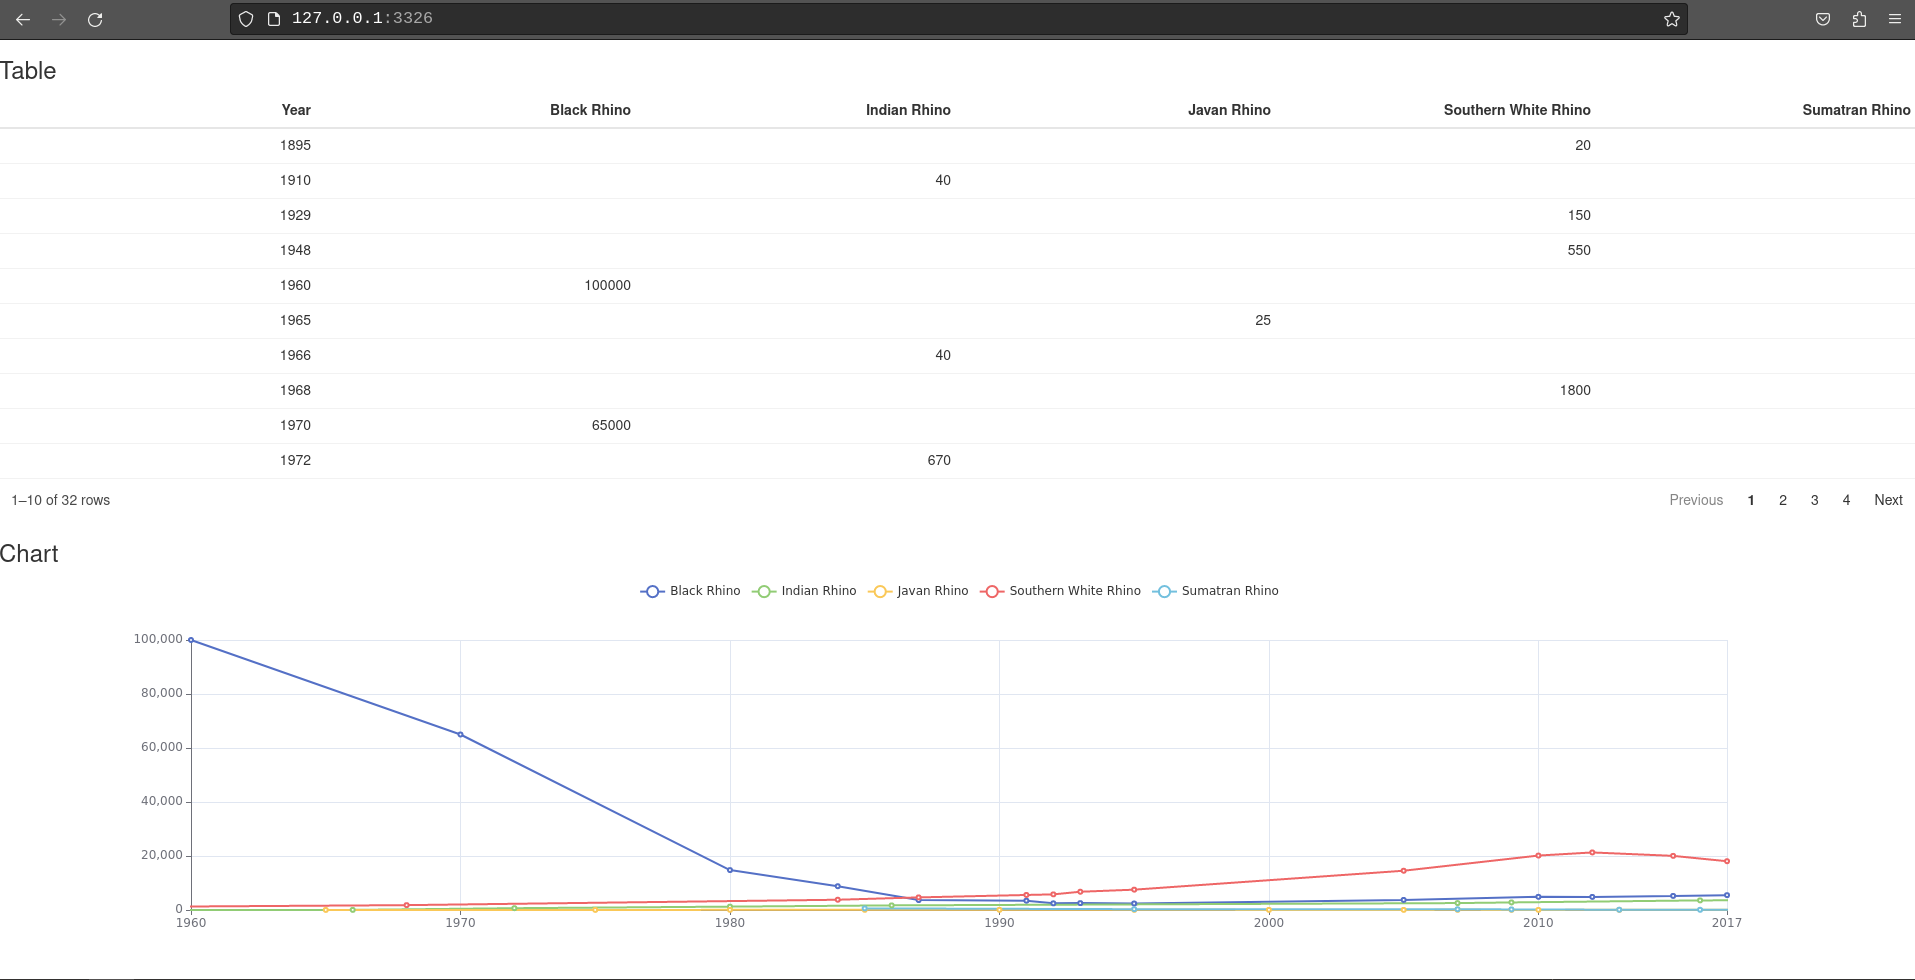
}Now you can run the application with shiny::runApp() (or
“Run app” button, if you use RStudio). You should see something like
this:
Add router
Next, let us move the table and the chart to separate pages using
shiny.router.
Install shiny.router
First, we need to install it:
# In R console
renv::install("shiny.router")
add to dependencies.R file:
# dependencies.R

# This file allows packrat (used by rsconnect during deployment) to pick up dependencies.
library(dplyr)
library(echarts4r)
library(htmlwidgets)
library(reactable)
library(rhino)
library(shiny.router)
library(tidyr)
and update renv.lock file:
# in R console
renv::snapshot()
Add routing
To enable routes in our application we need to modify the
app/main.R file:
- Import
shiny.routerfunctions:
# app/main.R

box::use(
  shiny[bootstrapPage, moduleServer, NS],
  shiny.router[router_ui, router_server, route]
)

...- Wrap UI modules in
router_ui:
# app/main.R

box::use(
  shiny[bootstrapPage, moduleServer, NS],
  shiny.router[router_ui, router_server, route]
)

box::use(
  app/view/chart,
  app/view/table,
)

#' @export
ui <- function(id) {
  ns <- NS(id)

  bootstrapPage(
    router_ui(
      route("table", table$ui(ns("table"))),
      route("chart", chart$ui(ns("chart")))
    )
  )
}

...
Each module needs to be called inside the route
function. The first argument there is the route where the UI will be
placed (so for example now the chart will be available at
{your app url}/chart).
- Add
router_serverto the server part of the main module:
# app/main.R

box::use(
  shiny[bootstrapPage, moduleServer, NS],
  shiny.router[router_ui, router_server, route]
)

box::use(
  app/view/chart,
  app/view/table,
)

#' @export
ui <- function(id) {
  ns <- NS(id)

  bootstrapPage(
    router_ui(
      route("table", table$ui(ns("table"))),
      route("chart", chart$ui(ns("chart")))
    )
  )
}

#' @export
server <- function(id) {
  moduleServer(id, function(input, output, session) {
    router_server("table")

    # Datasets are the only case when you need to use :: in `box`.
    # This issue should be solved in the next `box` release.
    data <- rhino::rhinos

    table$server("table", data = data)
    chart$server("chart", data = data)
  })
}
An important thing to mention here is that we had to provide the default route (“table”) that will be displayed once someone opens the application.
Now, when you run the application, you will see only the table. To check the chart, you need to change the URL and replace “table” with “chart”:
Change pages from UI
Using only the URL to change the view does not seem to be the easiest
way, so we need to add navigation. To avoid reinventing the wheel, we
will utilize Bootstrap
CSS classes available in shiny.
Let’s add a navbar with two links - one for each view:
- Import required functions from
shinyandshiny.router:
# app/main.R

box::use(
  shiny[a, bootstrapPage, moduleServer, tags, NS],
  shiny.router[router_ui, router_server, route, route_link],
)

...- Add navbar:
# app/main.R

box::use(
  shiny[a, bootstrapPage, moduleServer, tags, NS],
  shiny.router[router_ui, router_server, route, route_link],
)

box::use(
  app/view/chart,
  app/view/table,
)

#' @export
ui <- function(id) {
  ns <- NS(id)

  bootstrapPage(
    tags$nav(
      class = "navbar",
      tags$ul(
        class = "nav navbar-nav",
        tags$li(
          a("Table", href = route_link("table"))
        ),
        tags$li(
          a("Chart", href = route_link("chart"))
        )
      )
    ),
    router_ui(
      route("table", table$ui(ns("table"))),
      route("chart", chart$ui(ns("chart")))
    )
  )
}

...
Now, the route_link function will build the links to our
views. A user can simply click the button in the navbar and it will open
a table or chart:
Change pages from the server
The displayed page can be also changed from the server part of the application. To demonstrate that, we will add another page - an introduction with buttons that will move the user to either chart or table page.
First, create intro.R file in app/view
directory. We will start with adding a UI - two Bootstrap jumbotrons
with some descriptions and buttons:
# app/view/intro.R

box::use(
  shiny[actionButton, column, div, fluidRow, h2, moduleServer, NS, observeEvent],
)

#' @export
ui <- function(id) {
  ns <- NS(id)
  fluidRow(
    column(
      width = 6,
      div(
        class = "jumbotron",
        h2("Click this button to check out the table:"),
        actionButton(
          inputId = ns("go_to_table"),
          label = "Table",
          class = "btn-primary btn-lg"
        )
      )
    ),
    column(
      width = 6,
      div(
        class = "jumbotron",
        h2("Click this button to check out the chart:"),
        actionButton(
          inputId = ns("go_to_chart"),
          label = "Chart",
          class = "btn-primary btn-lg"
        )
      )
    )
  )
}
A new view has to be added to our application - modify
app/main.R:
# app/main.R

box::use(
  shiny[a, fluidPage, moduleServer, tags, NS],
  shiny.router[router_ui, router_server, route, route_link],
)

box::use(
  app/view/intro,
  app/view/chart,
  app/view/table,
)

#' @export
ui <- function(id) {
  ns <- NS(id)

  fluidPage(
    tags$nav(
      class = "navbar",
      tags$ul(
        class = "nav navbar-nav",
        tags$li(
          a("Home", href = route_link("/"))
        ),
        tags$li(
          a("Table", href = route_link("table"))
        ),
        tags$li(
          a("Chart", href = route_link("chart"))
        )
      )
    ),
    router_ui(
      route("/", intro$ui(ns("intro"))),
      route("table", table$ui(ns("table"))),
      route("chart", chart$ui(ns("chart")))
    )
  )
}

#' @export
server <- function(id) {
  moduleServer(id, function(input, output, session) {
    router_server("/")

    # Datasets are the only case when you need to use :: in `box`.
    # This issue should be solved in the next `box` release.
    data <- rhino::rhinos

    intro$server("intro")
    table$server("table", data = data)
    chart$server("chart", data = data)
  })
}
You might have noticed that we have changed the argument passed to
the router_server function. Now our default page will be
just the application URL. In fact, we could omit this argument,
since"/" is the default value there.
Now, we need to add logic for changing the page on button click:
# app/view/intro.R

box::use(
  shiny[actionButton, column, div, fluidRow, h2, moduleServer, NS, observeEvent],
  shiny.router[change_page],
)

#' @export
ui <- function(id) {
  ns <- NS(id)
  fluidRow(
    column(
      width = 6,
      div(
        class = "jumbotron",
        h2("Click this button to check out the table:"),
        actionButton(
          inputId = ns("go_to_table"),
          label = "Table",
          class = "btn-primary btn-lg"
        )
      )
    ),
    column(
      width = 6,
      div(
        class = "jumbotron",
        h2("Click this button to check out the chart:"),
        actionButton(
          inputId = ns("go_to_chart"),
          label = "Chart",
          class = "btn-primary btn-lg"
        )
      )
    )
  )
}

#' @export
server <- function(id) {
  moduleServer(id, function(input, output, session) {
    observeEvent(input$go_to_table, {
      change_page("table")
    })

    observeEvent(input$go_to_chart, {
      change_page("chart")
    })
  })
}
We used the change_page function to change the URL and
as a consequence, the displayed view.
Now, your application should behave like that:
Query parameters
Another feature of shiny.router that can be used in our
example is the ability to read query parameters from the URL. We will
demonstrate this by showing how you can control the number of rows
displayed in the table.
Read query parameter
We will start by adding an ability to read the pageSize
parameter, which will change the number of displayed rows (so for
example opening URL: {your app url}/table?pageSize=12) will
show a table with 12 rows).
Modify app/view/table.R:
# app/view/table.R

box::use(
  reactable,
  shiny[h3, moduleServer, NS, observeEvent, reactive, req, tagList],
  shiny.router[get_query_param],
)
box::use(
  app/logic/data_transformation[transform_data],
)

#' @export
ui <- function(id) {
  ns <- NS(id)

  tagList(
    h3("Table"),
    reactable$reactableOutput(ns("table"))
  )
}

#' @export
server <- function(id, data) {
  moduleServer(id, function(input, output, session) {
    ns <- session$ns

    page_size <- reactive({
      page_size <- get_query_param("pageSize")

      if (is.null(page_size)) {
        page_size <- 10
      }

      as.numeric(page_size)
    })

    output$table <- reactable$renderReactable({
      data |>
        transform_data() |>
        reactable$reactable(
          defaultPageSize = page_size()
        )
    })
  })
}
get_query_param reads the query parameters from an URL.
The value is then passed to the table to set the number of rows. If the
param is not set, it will display 10 rows.
Update query parameter
Let’s implement the opposite feature - we will add a page size dropdown to the table and update the query parameter according to its value.
First, add the page size option to the table:
# app/view/table.R

box::use(
  reactable,
  shiny[h3, moduleServer, NS, reactive, req, tagList],
  shiny.router[get_query_param],
)

box::use(
  app/logic/data_transformation[transform_data],
)

#' @export
ui <- function(id) {
  ns <- NS(id)

  tagList(
    h3("Table"),
    reactable$reactableOutput(ns("table"))
  )
}

#' @export
server <- function(id, data) {
  moduleServer(id, function(input, output, session) {
    ns <- session$ns

    page_size <- reactive({
      page_size <- get_query_param("pageSize")

      if (is.null(page_size)) {
        page_size <- 10
      }

      as.numeric(page_size)
    })

    output$table <- reactable$renderReactable({
      data |>
        transform_data() |>
        reactable$reactable(
          defaultPageSize = page_size(),
          showPageSizeOptions = TRUE,
          pageSizeOptions = c(5, 10, 15, 20, page_size()) |>
            unique() |>
            sort()
        )
    })
  })
}
Now you can change the page size using the table dropdown, but it still does not update the query parameter. To achieve that, we need to add one more element:
# app/view/table.R

box::use(
  reactable,
  shiny[h3, moduleServer, NS, observeEvent, reactive, req, tagList],
  shiny.router[change_page, get_query_param],
)

box::use(
  app/logic/data_transformation[transform_data],
)

#' @export
ui <- function(id) {
  ns <- NS(id)

  tagList(
    h3("Table"),
    reactable$reactableOutput(ns("table"))
  )
}

#' @export
server <- function(id, data) {
  moduleServer(id, function(input, output, session) {
    ns <- session$ns

    page_size <- reactive({
      page_size <- get_query_param("pageSize")

      if (is.null(page_size)) {
        page_size <- 10
      }

      as.numeric(page_size)
    })

    output$table <- reactable$renderReactable({
      data |>
        transform_data() |>
        reactable$reactable(
          defaultPageSize = page_size(),
          showPageSizeOptions = TRUE,
          pageSizeOptions = c(5, 10, 15, 20, page_size()) |>
            unique() |>
            sort()
        )
    })

    observeEvent(reactable$getReactableState("table", "pageSize"), {
      table_page_size <- reactable$getReactableState("table", "pageSize")

      if (table_page_size != page_size()) {
        change_page(paste0("table?pageSize=", table_page_size))
      }
    })
  })
}
This way changing the page size will modify the displayed query parameter:
404 page
As the final step, we will show how to handle a situation, when a
user tries to open a wrong URL. shiny.router comes with a
default 404 page that will be displayed in such case, but you can easily
replace it with a custom one.
We will build a new page, with a message and a button that will move the user back to the home page of the application.
Create a new file called page_404.R in the
app/view directory:
# app/view/page_404.R

box::use(
  shiny[a, div, h1, moduleServer, NS],
  shiny.router[route_link],
)

#' @export
ui <- function(id) {
  ns <- NS(id)

  div(
    h1("Whoops! Something went wrong!"),
    a("Back to home page", href = route_link("/"), class = "btn btn-primary btn-lg")
  )
}
Now, we need to add this custom view to the router as the 404 page:
# app/main.R

box::use(
  shiny[a, fluidPage, moduleServer, tags, NS],
  shiny.router[router_ui, router_server, route, route_link],
)
box::use(
  app/view/intro,
  app/view/chart,
  app/view/table,
  app/view/page_404,
)

#' @export
ui <- function(id) {
  ns <- NS(id)

  fluidPage(
    tags$nav(
      class = "navbar",
      tags$ul(
        class = "nav navbar-nav",
        tags$li(
          a("Home", href = route_link("/"))
        ),
        tags$li(
          a("Table", href = route_link("table"))
        ),
        tags$li(
          a("Chart", href = route_link("chart"))
        )
      )
    ),
    router_ui(
      route("/", intro$ui(ns("intro"))),
      route("table", table$ui(ns("table"))),
      route("chart", chart$ui(ns("chart"))),
      page_404 = page_404$ui(ns("page_404"))
    )
  )
}

...
And that’s it. If you run the application and try to go to a non-existing route, you should see something similar to this:
Congratulations! You have successfully upgraded your Rhino application with routing!