Build your first dynamic shiny.semantic app using layout and grid
Appsilon
2025-12-02
Source:vignettes/intro.Rmd
intro.RmdCreate UI inside documents
This is how you generate your first UI with
shiny.semantic:
uirender(
  shiny::tagList(
    h4("Numeric input", icon("world")),
    shiny.semantic::numeric_input("input", value = 0, label = ""),
    shiny.semantic::list_container(list(
        list(header = "Item 1", description = "My text for item 1", icon = "cat"),
        list(header = "Item 2", description = "My text for item 2", icon = "tree"),
        list(header = "Item 3", description = "My text for item 3", icon = "dog")
      ), is_divided = TRUE
    )
  ),
width = "200px", height = "280px")
Create a simple Shiny App
Let’s create a Shiny app with semanticPage() and just an
h1 title.

ui <- semanticPage(
  title = "My first page",
  h1("My page")
)

server <- function(input, output, session) {}

shinyApp(ui, server)
Built-in layouts
Now let’s add sidebar layout sidebar_layout() with a
sidebar panel sidebar_panel() and main panel
main_panel(). The sidebar is displayed with a distinct
background color and typically contains input controls. The main area
occupies 2/3 of the horizontal width and typically contains outputs.

ui <- semanticPage(
title = "My first page",
h1("My page"),
sidebar_layout(
sidebar_panel(),
main_panel()
)
)
server <- function(input, output, session) {}
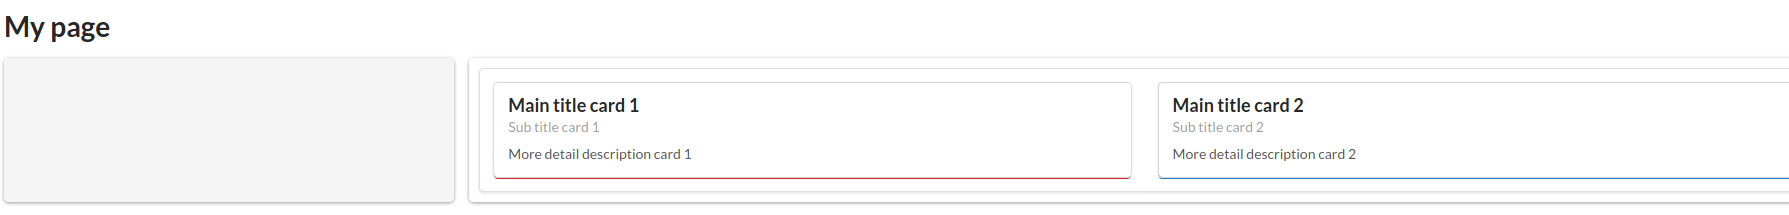
shinyApp(ui, server)Next let’s fill in the main panel main_panel() with a
Fomantic (Semantic previously) UI segment containing 2 cards.
ui <- semanticPage(
title = "My first page",
h1("My page"),
sidebar_layout(
sidebar_panel(),
main_panel(
segment(
cards(
class = "two",
card(class = "red",
div(class = "content",
div(class = "header", "Main title card 1"),
div(class = "meta", "Sub title card 1"),
div(class = "description", "More detail description card 1")
)
),
card(class = "blue",
div(class = "content",
div(class = "header", "Main title card 2"),
div(class = "meta", "Sub title card 2"),
div(class = "description", "More detail description card 2")
)
)
)
)
)
)
)
server <- function(input, output, session) {}
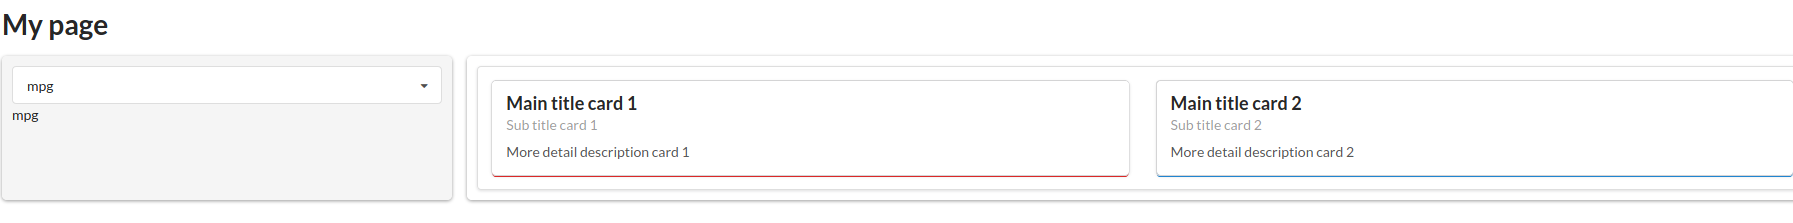
shinyApp(ui, server)Time to fill in sidebar sidebar_panel(), so let’s add a
dropdown. We create it input using dropdown_input().
ui <- semanticPage(
title = "My first page",
h1("My page"),
sidebar_layout(
sidebar_panel(
dropdown_input("mtcars_dropdown", c("mpg", "cyl", "disp", "hp"), value = "mpg"),
textOutput("dropdown")
),
main_panel(
segment(
cards(
class = "two",
card(class = "red",
div(class = "content",
div(class = "header", "Main title card 1"),
div(class = "meta", "Sub title card 1"),
div(class = "description", "More detail description card 1")
)
),
card(class = "blue",
div(class = "content",
div(class = "header", "Main title card 2"),
div(class = "meta", "Sub title card 2"),
div(class = "description", "More detail description card 2")
)
)
)
)
)
)
)
server <- function(input, output, session) {
output$dropdown <- renderText(input$mtcars_dropdown)
}
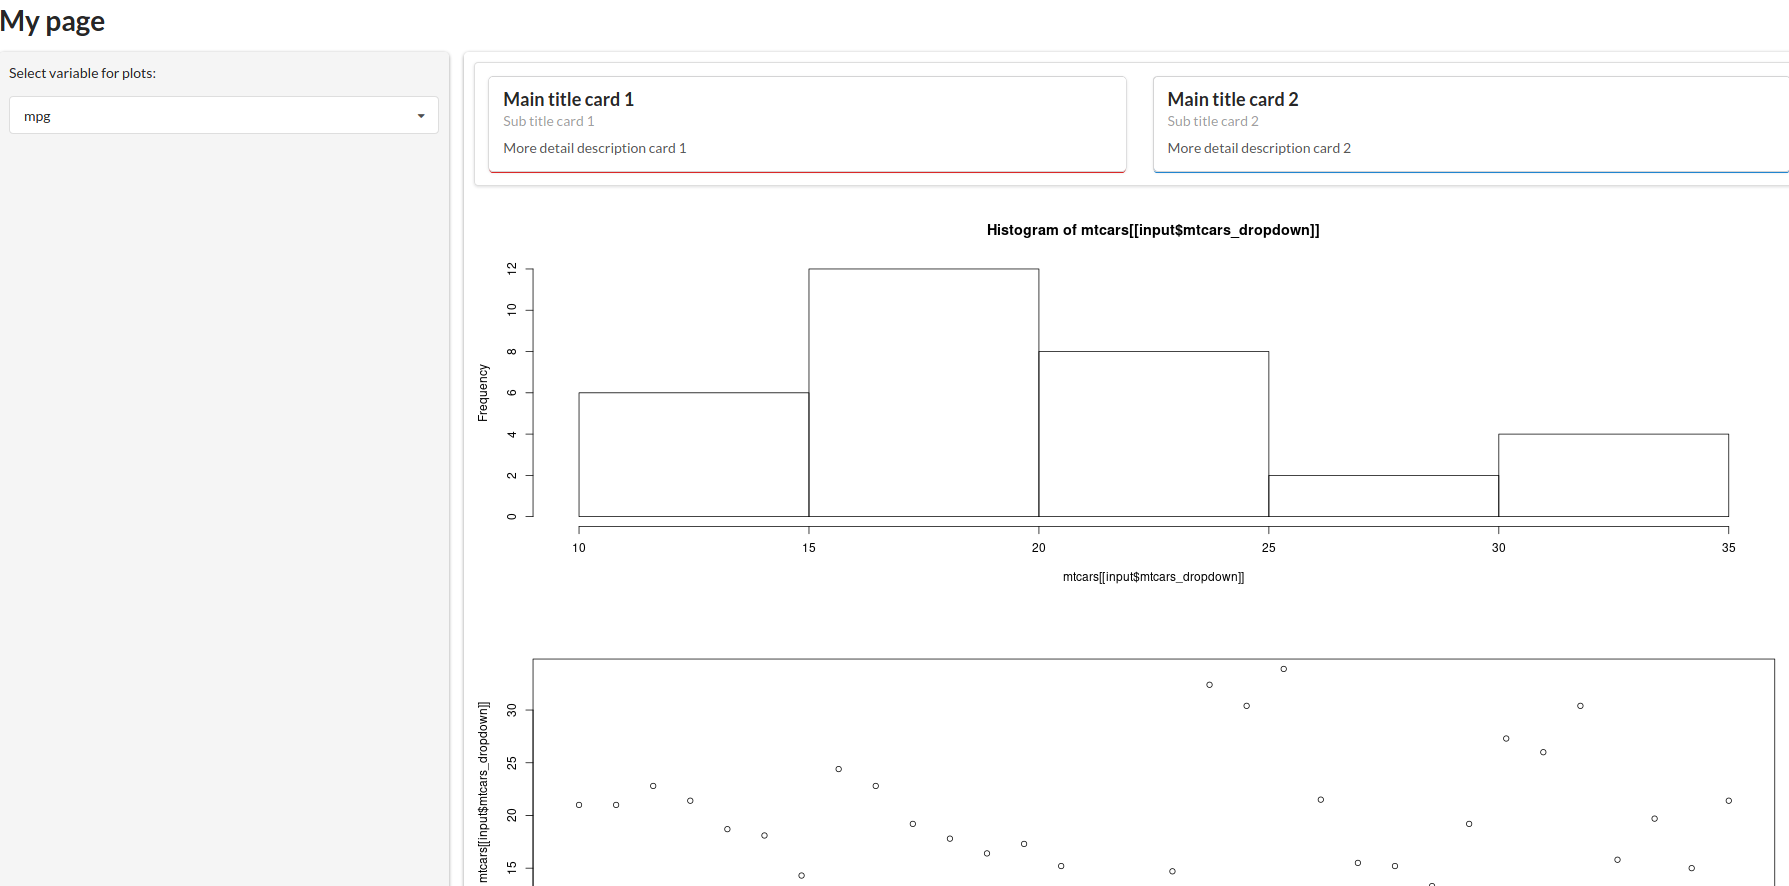
shinyApp(ui, server)Let’s make dropdown do something and generate a histogram and a
simple plot from a selected mtcars column using
dropdown.
ui <- semanticPage(
  title = "My first page",
  h1("My page"),
  sidebar_layout(
    sidebar_panel(
      p("Select variable for plots:"),
      dropdown_input("mtcars_dropdown", c("mpg", "cyl", "disp", "hp"), value = "mpg")
    ),
    main_panel(
      segment(
         cards(
           class = "two",
           card(class = "red",
             div(class = "content",
                 div(class = "header", "Main title card 1"),
                 div(class = "meta", "Sub title card 1"),
                 div(class = "description", "More detail description card 1")
             )
           ),
           card(class = "blue",
             div(class = "content",
                 div(class = "header", "Main title card 2"),
                 div(class = "meta", "Sub title card 2"),
                 div(class = "description", "More detail description card 2")
             )
           )
         )
      ),
      plotOutput("histogram"),
      plotOutput("plot")
      )
    )
)

server <- function(input, output, session) {
  output$dropdown <- renderText(input$mtcars_dropdown)
  output$histogram <- renderPlot(hist(mtcars[[input$mtcars_dropdown]]))
  output$plot <- renderPlot(plot(mtcars[[input$mtcars_dropdown]]))
}

shinyApp(ui, server)
There is more layouts that you can use. Just check the documentation
of: splitLayout, flow_layout,
vertical_layout and some more!
Grid templates
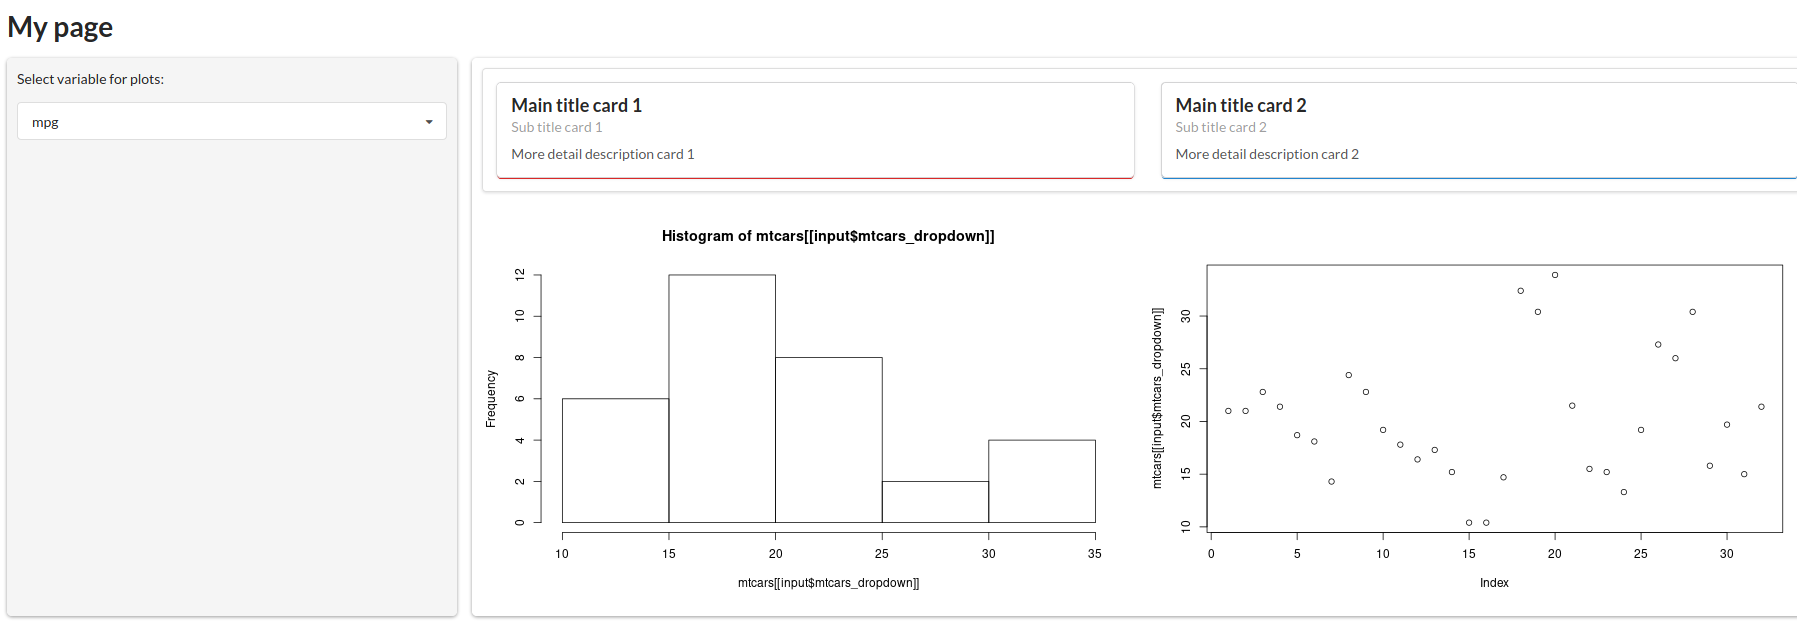
Finally let’s change the layout of the plots on the page and make
them appear next to each other. We will use grid() for it
and define a grid template using grid_template() with 1 row
and 2 columns of the same size. Our grid template will contain 2 areas
chart1 and chart2
grid_charts <- grid_template(
  default = list(areas = rbind(c("chart1", "chart2")),
                 rows_height = c("100%"),
                 cols_width = c("50%", "50%"))
)
We assign plots’ outputs plotOutput() to both areas
inside the grid function.
This is the final effect of our work:
ui <- semanticPage(
  title = "My first page",
  h1("My page"),
  sidebar_layout(
    sidebar_panel(
      p("Select variable for plots:"),
      dropdown_input("mtcars_dropdown", c("mpg", "cyl", "disp", "hp"), value = "mpg")
    ),
    main_panel(
      segment(
         cards(
           class = "two",
           card(class = "red",
             div(class = "content",
                 div(class = "header", "Main title card 1"),
                 div(class = "meta", "Sub title card 1"),
                 div(class = "description", "More detail description card 1")
             )
           ),
           card(class = "blue",
             div(class = "content",
                 div(class = "header", "Main title card 2"),
                 div(class = "meta", "Sub title card 2"),
                 div(class = "description", "More detail description card 2")
             )
           )
         )
      ),
      grid(grid_charts,
           chart1 = plotOutput("histogram"),
           chart2 = plotOutput("plot")
         )
      )
    )
)

server <- function(input, output, session) {
  output$dropdown <- renderText(input$mtcars_dropdown)
  output$histogram <- renderPlot(hist(mtcars[[input$mtcars_dropdown]]))
  output$plot <- renderPlot(plot(mtcars[[input$mtcars_dropdown]]))
}

shinyApp(ui, server)
You can define grids for different screen sizes. Here is an example on how to define it for mobile.